Biodiversity & Forest-Health Screening from Satellites
Get your CSRD / TNFD -friendly site-level indicators in minutes—no GIS required. Upload your area, get biodiversity metrics, vegetation indices, and your report with an AI summary .
Live Demo
Try the Mexico restoration demo (Site 1 & reference Site 2). Explore biodiversity metrics, vegetation trends, satellite composites, and exporting reports directly in the browser.
What you get in minutes
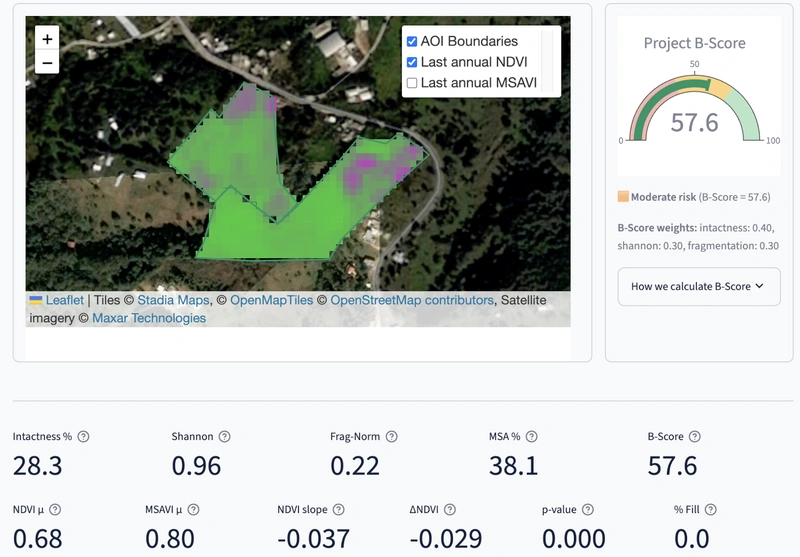
- B-Score (0–100): pressure-aware biodiversity proxy ( Intactness , Shannon , Fragmentation ; MSA / EFA/EFT where available).
- Habitat & Fragmentation : ESRI 10 m land-cover, Intactness %, normalized Fragmentation .
- Vegetation trends: NDVI / MSAVI composites, Seasonal decomposition , Slope changes over time.
- One-click exports: Evidence Pack with a PDF Report and AI executive summary , metrics in CSV format, satellite images.
- AOI portfolio: run multiple sites; compare baselines and trends.
- Transparent methods: documented formulas and data sources.
How it works
-
 Step 1 — Upload or select AOIs
 GeoJSON or pick a demo (Mexico restoration + reference plot).
-
 Step 2 — Compute
 Satellite pulls, cloud masking, vegetation indices calculation, metrics engine, B-Score .
-
 Step 3 — Decide
 Map overlays, KPIs, risk band, charts, export Evidence Pack with report and AI summary .
Typical run time: 2–10 minutes per site depending on area and date range.
Science & Data
VerdeSat blends structural habitat metrics and vegetation dynamics; where available, we include pressure adjustments (e.g., GLOBIO MSA ) and functional attributes ( EFA/EFT ). Outputs are screening-grade indicators aligned with CSRD / TNFD concepts (ecosystem extent/condition, pressures). AI summary is drafted by an LLM from your AOI metrics & NDVI time-series. All numbers are auto-verified against the inputs. Use as a starting point; please review before sharing or filing.
- Sentinel-2 L2A (10 m)
- ESRI 10 m land-cover
- MSA (GLOBIO, 300 m, 2015)
- EFA/EFT (300 m, 10-day, coming soon)
- WDPA/KBA (context)
MSA currently 2015 snapshot; coarse vs fine resolution handled at AOI summary scale; NDVI saturation in dense canopies considered in interpretation.
Who it’s for
Corporate ESG / Supply Chain
CSRD / TNFD -friendly risk screening; site-level KPIs and PDF annexes.
Consultancies & Auditors
White-label reports; API hooks for due diligence workflows.
Restoration & NGOs
Track restoration progress; share donor-ready summaries.
Investors & Funds
Portfolio screening; rank sites by risk and trend.
For Investors
- Why now: CSRD / TNFD accelerating biodiversity disclosure; remote-sensing fills the data gap.
- What's live: MVP app with B-Score , habitat/ Fragmentation , NDVI analytics; one-click PDF.
- Traction: Mexican restoration pilot, additional pilots in pipeline.
- Moat: transparent methods + simple UX; app-first delivery; low-cost R2 + Titiler; API roadmap (FastAPI+PostGIS+Queue).
- Roadmap (12–16 weeks): AI functionality, API core, climate variables and EFA / MSA integration, forecasting, CSRD tables.
FAQ
Is B-Score “regulatory-grade”?
Screening-grade at the moment; supports CSRD / TNFD drafts with transparent caveats.
Can I use my own polygons?
Yes, upload GeoJSON.
Can we validate with field data?
Yes; GBIF & partner datasets optional.
Do you support other ecosystems?
Forests first; croplands/wetlands/grasslands in roadmap.
Contact
Questions from customers or investors? We'd love to hear from you.
Methods & Limitations
- B-Score : 0–100 composite of Intactness , Shannon (land-cover diversity), Fragmentation (biome-normalized). Optional pressure adjustment where MSA / EFA/EFT available.
- Data: Sentinel-2 (10 m); ESRI LULC (10 m); MSA (300 m, 2015); EFA/EFT (300 m); WDPA/KBA for context.
- Scale handling: metrics computed at AOI summary scale to avoid pixel-dominance across resolutions.
- Caveats: NDVI saturation in dense canopies; MSA is 2015 snapshot; EFA latency 10–20 days.
- Intended use: screening-grade; supports CSRD / TNFD drafts; field validation recommended for regulatory sign-off.